As you start your research journey, you’ll encounter numerous challenges, and one of the most significant obstacles you’ll face is the presence of confounding variables. These variables, which often go unmeasured, can influence both the variable you think is the cause and the one you believe is the effect. If you’re not careful, confounding variables can lead you astray, making you believe there’s a relationship between two variables when, in reality, it’s the confounding variable pulling the strings behind the scenes.
What is a confounding variable?
A confounding variable, also known as a confounder or a confounding factor, is an extraneous variable that is associated with both the independent and dependent variables in a study. This association can create a spurious relationship between the variables of interest, making it difficult to determine the true cause-and-effect relationship.
To become “confounder,” a variable must meet two important criteria:
- Correlate with independent variables.They don’t have to be causally related, but they need to hang out together and show some correlation.
- It must have a direct, causal impact on the dependent variable..
Example of a confounding variable
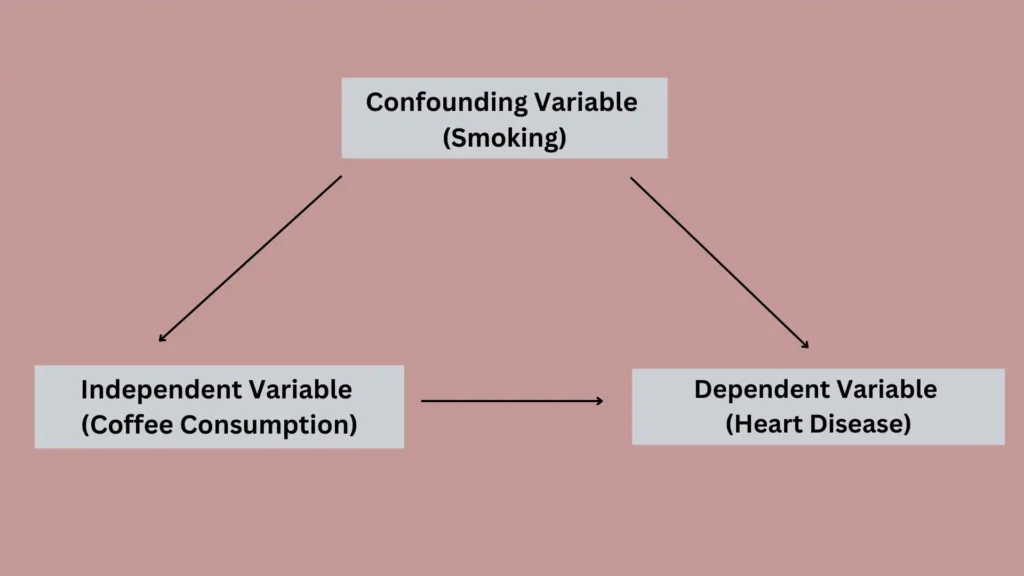
Imagine you’re conducting a study to investigate the relationship between coffee consumption and the risk of heart disease. You find that individuals who drink more coffee have a higher incidence of heart disease. However, upon further examination, you discover that coffee drinkers are also more likely to be smokers.
In this case, smoking is a confounding variable because it is associated with both coffee consumption (your independent variable) and heart disease (your dependent variable). Without accounting for smoking, you may erroneously conclude that coffee causes heart disease, when in reality, it is the smoking that is responsible for the increased risk.
Conceptual model with a confounding variable
Why confounding variables matter
Confounding variables can lead to biased results and incorrect conclusions in your research. When you fail to account for a confounding variable, the observed relationship between your independent and dependent variables may be distorted, leading you to overestimate, underestimate, or even reverse the true effect.
Example
Suppose you’re examining the effectiveness of a new medication for treating depression. You compare the improvement in symptoms between a group receiving the medication and a control group receiving a placebo. You find that the medication group shows a significantly greater improvement in symptoms compared to the placebo group.
However, upon closer inspection, you realize that the medication group had a higher proportion of participants with mild depression, while the placebo group had more participants with severe depression. In this case, the severity of depression is a confounding variable.
If you don’t control for this variable, you may overestimate the effectiveness of the medication, as the observed improvement could be due to the differences in depression severity between the groups.
How to reduce the impact of confounding variables
As a researcher, you have various strategies at your disposal to minimize the impact of confounding variables and improve the validity of your findings. These strategies include restriction, matching, statistical control, and randomization.
Restriction
Restriction involves limiting your study population to individuals who share the same characteristics for the potential confounding variable. By doing so, you hold the confounding variable constant, reducing its influence on the relationship between your independent and dependent variables.
Restriction Example
If you’re investigating the effect of alcohol consumption on liver disease, you may restrict your study population to non-smokers. This restriction eliminates smoking as a confounding variable, as all your participants will have the same smoking status.
Matching
Matching involves pairing participants in your study groups based on their characteristics for the potential confounding variable. By ensuring that your groups are balanced with respect to the confounder, you can minimize its impact on your study results.
Matching Example
Let’s say you’re comparing the effectiveness of two different treatments for hypertension. You may match participants in your treatment groups based on age, gender, and body mass index (BMI). This matching ensures that your groups are similar in terms of these potential confounding variables, reducing their influence on the treatment outcomes.
Statistical control
Statistical control involves using mathematical techniques to adjust for the effects of confounding variables during your data analysis. By including the confounding variables in your statistical models, you can estimate the independent effect of the variable you’re interested in while holding the confounders constant.
Statistical control example
If you’re examining the relationship between air pollution and respiratory illness, you may use multiple regression analysis to control for potential confounding variables such as age, gender, and smoking status. By including these variables in your regression model, you can estimate the effect of air pollution on respiratory illness while adjusting for the influence of the confounders.
Randomization
Randomization is a powerful tool you can use to reduce the impact of confounding variables. By randomly assigning participants to different study groups, you can ensure that the potential confounders are evenly distributed across the groups. This balance minimizes the systematic differences between the groups, allowing you to more accurately assess the relationship between your independent and dependent variables.
Randomization Example
Imagine you’re conducting a clinical trial to evaluate the efficacy of a new drug for treating hypertension. You randomly assign participants to receive either the drug or a placebo. Randomization ensures that potential confounding variables, such as age, gender, and BMI, are evenly distributed between your treatment and control groups. This balance reduces the impact of these variables on your study results, increasing the validity of your findings.