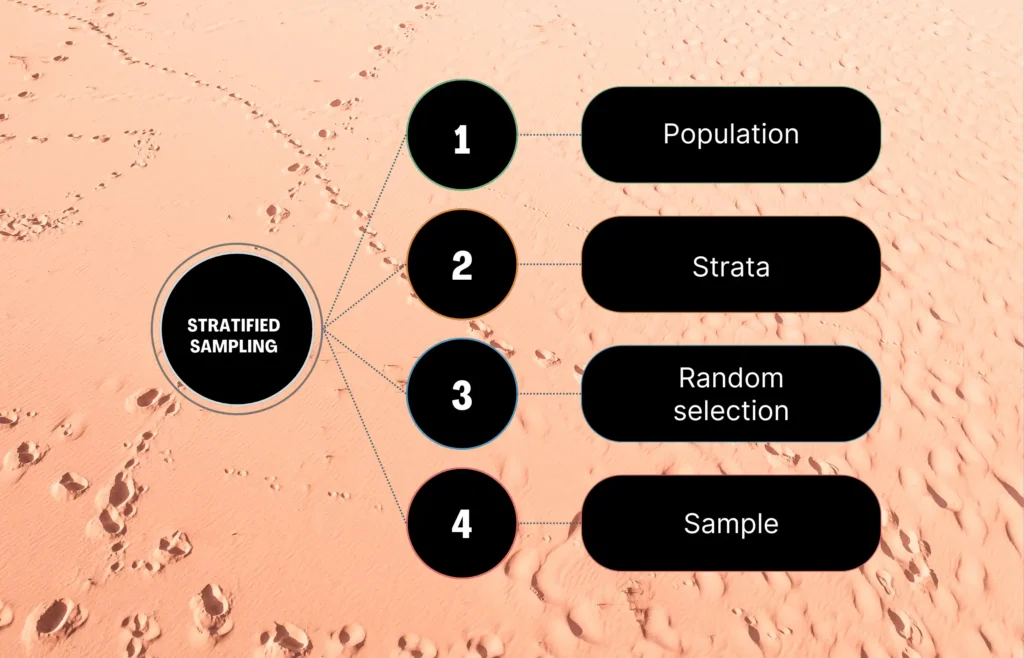
Stratified sampling is a powerful statistical technique for obtaining a more representative population sample. This method of sampling involves dividing your population into distinct subgroups or “strata” based on specific characteristics, such as age, gender, or income level.
A stratified random sample is taken from each stratum, ensuring that the sample accurately reflects the characteristics of the entire population. This approach is particularly useful when you know your population contains subgroups with different properties, helping to reduce bias and increase precision.
Unlike systematic sampling, which selects participants at regular intervals, stratified sampling ensures that all relevant subgroups are proportionally represented in the study. This method is beneficial when the differences between subgroups are significant and must be accounted for in the analysis.
For example, if you’re conducting a survey on student satisfaction at a university, stratifying by factors like academic program, year of study, or student housing could give you much more meaningful and actionable insights.
When to Use Stratified Random Sampling
Stratified sampling is a probability sampling method where the population is divided into distinct subgroups (strata) based on shared characteristics, and then a random sample is drawn from each stratum. This method is useful in the following situations:
Ensuring the diversity of your sample
When the population consists of distinct subgroups important to the research objectives, stratified sampling can ensure that each subgroup is adequately represented in the sample.
For example, if a university wants to survey students about campus facilities and the student body is composed of undergraduate, graduate, and professional students, stratified sampling can select a proportional number of students from each level. This ensures that the diverse perspectives of all student types are captured in the sample.
Ensuring similar variance
Stratified sampling is effective when the variability within each stratum is smaller than between strata. The overall sample variability is reduced by dividing the population into homogeneous subgroups.
For instance, if a company wants to study employee satisfaction across different departments, stratifying by department can help minimize the variability in satisfaction levels within each department, making it easier to detect differences between departments.
Lowering the overall variance in the population
By stratifying the population and sampling from each stratum, the overall variance in the sample can be reduced compared to simple random sampling. This is because the variability within each stratum is typically lower than the variability across the entire population.
For example, if a city wants to estimate the average household income, stratifying by neighborhood socioeconomic status can help reduce the overall variance in income levels, leading to more precise estimates.
Allowing for a variety of data collection methods
Stratified sampling can be useful when different data collection methods are required for different subgroups.
For instance, if a health organization wants to study the prevalence of a disease across age groups, it may need to use different screening methods for children, adults, and the elderly. By stratifying by age group, they can apply the appropriate data collection method to each stratum, ensuring the validity and comparability of the results.
Research example
You are a researcher studying the job satisfaction of nurses in a large hospital system. The hospital has nurses working in various departments, such as emergency, surgery, pediatrics, and oncology, with different work environments and challenges. To ensure that your sample represents the diverse experiences of nurses across departments, you could use stratified sampling. You would first divide the population of nurses into strata based on their department. Then, you would randomly sample a proportional number of nurses from each department to create a representative sample.
For instance, if the hospital has 1000 nurses with 30% in emergency, 25% in surgery, 20% in pediatrics, and 25% in oncology, and you want a sample size of 200, you would select 60 nurses from emergency, 50 from surgery, 40 from pediatrics, and 50 from oncology.
Steps for Implementing Stratified Sampling Methods
Stratified sampling is useful when researchers want to ensure that specific subgroups within the population are adequately represented in the sample or when they aim to compare different subgroups and ensure that the sample size for each subgroup is sufficient for meaningful analysis.
Implementing stratified sampling involves several key steps:
Step 1: Define your population and subgroups
The first step in stratified sampling is defining the population you want to study and identifying the relevant subgroups (strata) within that population. This involves specifying the characteristics an element must possess to be included in the population and determining the key characteristics that will be used to divide the population into strata.
Choosing characteristics for stratification
When selecting characteristics for stratification, consider factors likely to influence your study’s variable(s) of interest. These characteristics should create subgroups that are internally homogeneous but distinct from each other. Common stratification characteristics include demographics (e.g., age, gender, race/ethnicity), geographic location, socioeconomic status, or any other relevant attribute to your research question.
For example, if you are studying the prevalence of a disease in a city, you might choose to stratify by age groups (e.g., children, adults, elderly) because disease rates often vary by age. Similarly, if you are investigating income inequality, you might stratify by neighborhood or zip code to capture the spatial distribution of income levels.
Stratifying by multiple characteristics
Sometimes, you may want to stratify your population by more than one characteristic to create more specific and homogeneous subgroups. This is known as multi-stage stratification or cross-stratification.
For instance, if you are researching academic achievement in a school district, you might first stratify by school level (elementary, middle, high school) and then by student socioeconomic status (low, middle, high) within each school level. This would create six distinct strata: low-SES elementary students, middle-SES elementary students, high-SES elementary students, and so on.
Example: Stratifying by multiple characteristics
If you are studying customer satisfaction at a national retail chain, you might stratify your population by geographic region (e.g., Northeast, Southeast, Midwest, West) and by customer type (e.g., frequent shoppers, occasional shoppers, first-time customers) to ensure that your sample represents the diverse experiences of customers across the country and with different shopping habits.
Step 2: Separate the population into strata
After defining your population and identifying the relevant characteristics for stratification, the next step is to divide the population into distinct subgroups or strata based on those characteristics. Each stratum should be mutually exclusive and collectively exhaustive, meaning that every element in the population belongs to one and only one stratum and all strata together cover the entire population.
Example: Separating the population into strata
Imagine you are a researcher at a university studying student satisfaction with campus facilities. To ensure your sample represents the diverse perspectives of the 10,000 students, you decide to stratify the population by student type: 6,000 undergraduate students (60%), 3,000 graduate students (30%), and 1,000 professional students (10%). By separating the population into these strata, you create more homogeneous subgroups, allowing for a representative sample and enabling comparisons between the satisfaction levels of different student types.
Here’s a table separating the university student population into strata:
| Stratum | Number of Students | Proportion of Total Population |
| Undergraduate students | 6,000 | 60% |
| Graduate students | 3,000 | 30% |
| Professional students | 1,000 | 10% |
| Total | 10,000 | 100% |
Step 3: Decide on the sample size for each stratum
After separating the population into strata, the next step is determining each stratum’s sample size. This decision involves considering the total sample size needed for your study and how to allocate that sample size among the strata.
Proportionate versus disproportionate sampling
There are two main approaches to allocating the sample size among strata: proportionate and disproportionate sampling.
- Proportionate sampling: In this approach, the sample size for each stratum is proportional to the population size. This means that the proportion of the total sample coming from each stratum is the same as that of the population. Proportionate sampling ensures that each stratum is represented in the sample according to the size of the population.
- Disproportionate sampling: In this approach, the sample size for each stratum is not proportional to the stratum’s size in the population. Researchers might oversample smaller strata to ensure adequate representation or undersample larger strata to reduce costs. Disproportionate sampling can be useful when some strata are more important for the research question or when there is significant variability within certain strata.
Sample size
To determine the total sample size for your study, consider factors such as the desired precision level, the population variability, and the available resources. Various statistical methods and formulas can be used to calculate the appropriate sample size based on these factors.
Once you have determined the total sample size, you can allocate it among the strata using proportionate or disproportionate sampling, depending on your research goals and constraints.
Example: Sample size
Suppose you, as a university researcher studying student satisfaction with campus facilities, determine that a total sample size of 1,000 students is needed for your study. Using proportionate sampling, you would allocate the sample size as follows: 600 undergraduate students (60%), 300 graduate students (30%), and 100 professional students (10%), ensuring that each stratum is represented according to its size in the population of 10,000 students.
Step 4: Randomly sample from each stratum
After determining the sample size for each stratum, the final step is to select the actual elements (students, in this case) from each stratum to include in your sample. Use random sampling techniques within each stratum to ensure an unbiased and representative sample. This means that every element within a stratum has an equal chance of being selected.
Example: Random sampling
In the university student satisfaction study example, suppose you have determined the sample size for each stratum: 600 undergraduate students, 300 graduate students, and 100 professional students. You would use random sampling techniques within each stratum to select the specific students to include in your sample. This could involve assigning a unique number to each student within a stratum and then using a random number generator to select the required number of students. For example, you might randomly select 600 students from the list of all 6,000 undergraduate students, 300 students from the list of all 3,000 graduate students, and 100 students from the list of all 1,000 professional students.