In scientific research and data analysis, measurement error is the difference between an observed value and the true value of the phenomenon being studied. This error can be classified into two main categories: random and systematic. Understanding the differences between these types of errors is crucial for ensuring the accuracy and reliability of research findings.
Random error, also known as statistical error or noise, is a measurement error caused by chance fluctuations in the data.
Systematic error, also known as bias, is a measurement error that consistently skews the data in a particular direction. Unlike random errors, systematic errors do not cancel each other out over multiple measurements and can lead to a consistent over- or underestimation of the true value.
Example of Random Error
Suppose a researcher is measuring the weight of a sample using a digital scale. Due to the researcher’s inconsistent sample placement on the scale, the measurements vary slightly each time: 10.2 g, 10.1 g, 10.3 g, 10.0 g, and 10.2 g. These fluctuations are an example of random error, as they are not consistently in one direction and are likely to cancel each other out if the measurement is repeated many times.
Example of Systematic Error
Let’s consider the example of the digital scale again. If the scale is not properly calibrated and consistently reads 0.5 grams too heavy, all measurements made with that scale will be systematically skewed. For instance, if the true weights of the samples are 10.0 g, 9.8 g, 10.2 g, 9.9 g, and 10.1 g, the scale will record them as 10.5 g, 10.3 g, 10.7 g, 10.4 g, and 10.6 g, respectively. This consistent overestimation is an example of systematic error, as it affects the accuracy of the data.
Are random or systematic errors worse?
Both random and systematic errors can be problematic, but systematic errors are generally considered more detrimental to the validity of results. Random errors cancel each other out over multiple measurements, while systematic errors consistently skew the data in a particular direction. Systematic errors can lead to incorrect conclusions and flawed decision-making, as they introduce a consistent bias in the data.
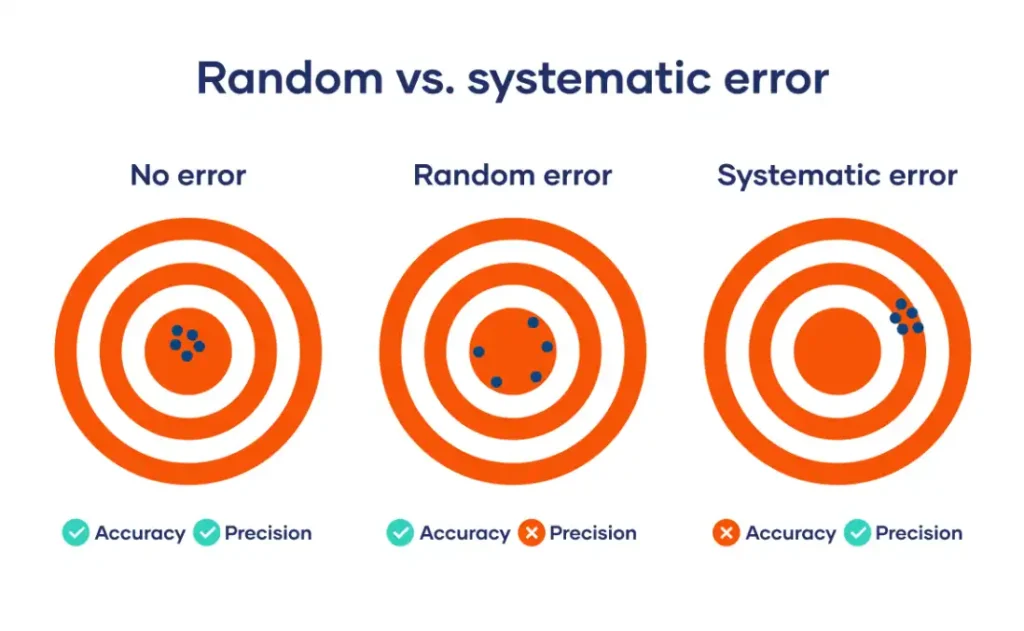
Precision vs Accuracy
To better understand the difference between random and systematic errors, it’s essential to grasp the concepts of precision and accuracy:
- Precision refers to the closeness of repeated measurements to each other. High precision means the measurements are consistent, even if they are not necessarily accurate.
- Accuracy refers to the closeness of a measurement to the true value. High accuracy means that the measurements are close to the actual value, even if they are not precise.
Random errors affect precision, while systematic errors affect accuracy.
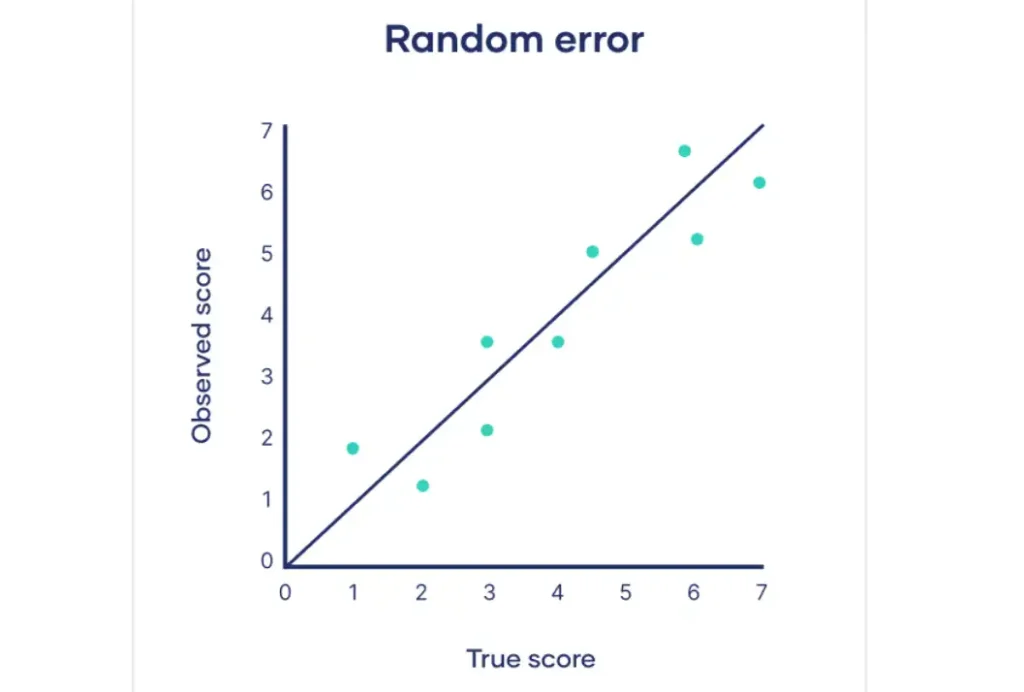
Random error
Random error, also known as statistical error, is a type of error that occurs due to unpredictable fluctuations in measurements. These fluctuations can be caused by various factors and lead to inconsistencies in the data. The key characteristic of random errors is that they are not consistently in one direction and tend to cancel each other out over multiple measurements.
Sources of random errors
The common sources of random errors are explained below:
- Natural variations in real-world or experimental contexts: Random errors can arise from inherent variability in the measured subject. For example, when measuring the height of plants in a field, natural variations in soil quality, sunlight exposure, and genetic differences among the plants can introduce random errors in the measurements.
- Imprecise or unreliable measurement instruments: Measurement tools that are not correctly calibrated or have inherent limitations can introduce random errors. For instance, a poorly calibrated thermometer may give slightly different readings each time, even under the same conditions.
- Individual differences between participants or units: Individual differences can contribute to random errors in studies involving human participants or other living organisms. For example, when measuring reaction times in a psychology experiment, participants’ alertness, motivation, and familiarity with the task can vary, leading to inconsistencies in the data.
- Poorly controlled experimental procedures: Inconsistencies in experimental settings or protocols can introduce random errors. For instance, if the lighting conditions in a laboratory vary between measurements, it can lead to random fluctuations in the data.
Random errors can be minimized by increasing the number of measurements, using more precise instruments, and implementing strict experimental controls. However, it is impossible to eliminate random errors.
Reducing random error
Random error is an inherent part of any measurement process, but there are several strategies researchers can employ to minimize its impact on their results.
Take repeated measurements
One of the most effective ways to reduce random error is to take multiple measurements of the same phenomenon under the same conditions. By repeating the measurement process several times and calculating the average value, researchers can minimize the impact of chance fluctuations in the data.
Example: If a researcher is measuring the length of a room using a tape measure, they may obtain slightly different values each time due to minor variations in the placement of the tape measure or the researcher’s perception.
Increase your sample size
Another way to reduce random error is to increase the study’s sample size. By collecting data from a larger number of subjects or observations, researchers can reduce the impact of individual variations and obtain a more representative sample of the population being studied.
For instance, if a researcher is surveying a population to determine the average age, they can minimize the impact of random error by surveying a large number of individuals rather than relying on a small, potentially unrepresentative sample.
Control variables
Controlling variables is another important strategy for reducing random error. By keeping other factors that could influence the measurement process constant, researchers can isolate the effect of the studied variable and minimize the impact of chance fluctuations.
Example: If a researcher is measuring the effect of a new drug on blood pressure, they may control variables such as the time of day, the patient’s posture, and the type of blood pressure monitor used to ensure that any observed changes in blood pressure are due to the drug itself rather than other factors.
Systematic error
Systematic error, also known as bias, is a measurement error that consistently skews the data in a particular direction. Unlike random errors, which can be minimized through repeated measurements and large sample sizes, systematic errors can be more challenging to detect and correct. Understanding the types and sources of systematic errors is crucial for ensuring the accuracy and validity of scientific measurements and results.
Types of systematic errors
There are two main types of systematic errors:
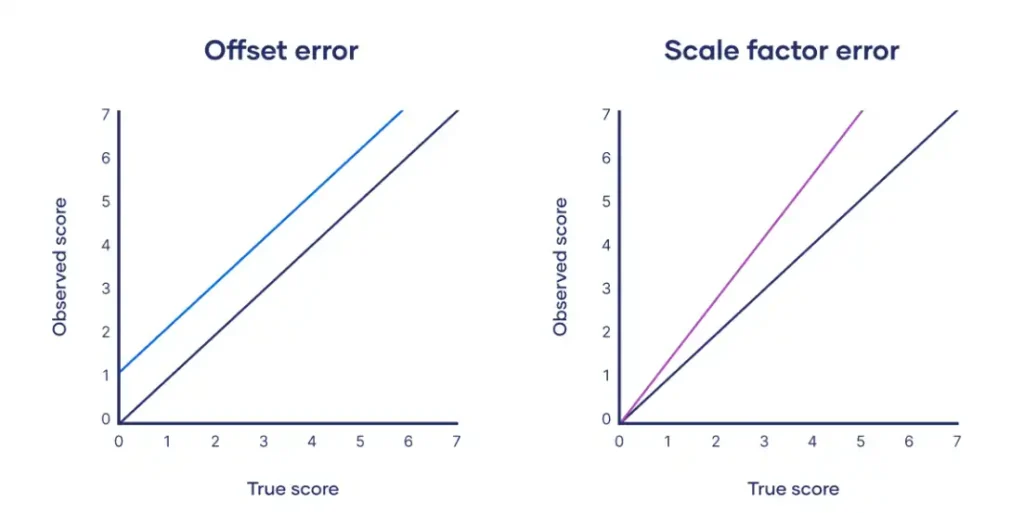
Offset error
Also known as zero error, offset error occurs when a measuring instrument consistently yields values that are either higher or lower than the true value by a fixed amount. This type of error results in a constant difference between the observed and true values, regardless of the magnitude of the measurement.
Example: Offset error
Suppose a thermometer consistently reads 2°C higher than the true temperature due to a calibration error. If the true temperature of a room is 20°C, the thermometer will read 22°C. Similarly, if the true temperature is 30°C, the thermometer will read 32°C. The constant difference of 2°C between the observed and true values is an example of offset error.
Scale factor error
Scale factor error occurs when a measuring instrument consistently yields values proportionally higher or lower than the true value. This type of error results in a difference between the observed and true values that increases or decreases with the magnitude of the measurement.
Example: Scale factor error
Consider a spring scale that consistently measures weights 5% higher than the true value due to a manufacturing defect. If an object with a true weight of 100 g is placed on the scale, it will read 105 g. Similarly, if an object with a true weight of 200 g is placed on the scale, it will read 210 g. The proportional difference between the observed and true values is an example of scale factor error.
Plotting offset errors and scale factor errors on graphs can help us better understand their differences.
Sources of systematic errors
Systematic errors can arise from various aspects of the research process, including the materials used, data collection procedures, and analysis techniques. While not exhaustive, the following list highlights some common sources of systematic errors:
Response Bias
Response bias occurs when the research materials, such as questionnaires or surveys, influence participants to respond or behave in ways that do not accurately reflect their true opinions or experiences. One example of response bias is social desirability bias, where participants tend to provide answers that conform to societal norms or expectations, even if those answers do not align with their genuine feelings or beliefs. This can happen when the questions are phrased in a leading manner or when the participants feel pressured to present themselves in a certain light.
Experimenter Drift
Experimenter drift is the gradual departure from standardized research procedures by observers or experimenters throughout a study. This can occur when the individuals responsible for data collection or coding become tired, bored, or less motivated after prolonged work. As a result, they may start to deviate from the established protocols in subtle but identifiable ways, introducing systematic errors into the data. Experimenter drift can compromise the consistency and reliability of the data collected, making it difficult to draw accurate conclusions from the study.
Sampling Bias
Sampling bias arises when certain population members are more likely to be selected for a study than others. This can lead to a sample that is not representative of the entire population, limiting the generalizability of the findings. Sampling bias can occur due to various factors, such as the accessibility of certain groups, the recruitment methods used, or the inclusion and exclusion criteria applied.
Example: If a study on the effects of a new medication only includes participants from a specific age group or geographic location, the results may not apply to the broader population.
Instrument Bias
Instrument bias refers to systematic errors that arise from the tools or devices used to measure or collect data. This can happen when the instruments are not properly calibrated, have inherent flaws, or are unsuitable for the specific measurement task. For instance, if a weighing scale consistently reads values 0.5 kg higher than the true weight, it will introduce a systematic error in all measurements made with that scale.
Reducing systematic error
Systematic errors can significantly impact the accuracy and validity of research findings, making it essential for researchers to take steps to minimize their influence. Several strategies, including triangulation, regular calibration, randomization, and masking, can be employed to reduce systematic errors.
Triangulation
Triangulation involves using multiple methods, sources, or observers to collect and analyze data. By comparing and cross-checking the results obtained through different approaches, researchers can identify and reduce systematic errors that may arise from relying on a single method or perspective. There are several types of triangulation:
- Methodological triangulation: Using multiple data collection methods, such as surveys, interviews, and observations, to study the same phenomenon.
- Data triangulation: Collecting data from different sources, such as participant groups or time points, to gain a more comprehensive understanding of the topic.
- Investigator triangulation: Involving multiple researchers in the data collection and analysis process to minimize individual biases.
Regular calibration
Regular calibration of instruments and equipment is crucial for reducing systematic errors arising from instrument bias. By ensuring that the tools used for measurement are accurately calibrated and functioning properly, researchers can minimize the impact of systematic errors on their data. This involves:
- Establishing a schedule for regular calibration of instruments based on the manufacturer’s recommendations and the frequency of use.
- Using certified reference materials or standards to verify the accuracy of the instruments.
- Documenting the calibration process and results to record the instrument’s performance over time.
Randomization
Randomization is a powerful tool for reducing systematic errors, particularly those arising from sampling bias and confounding variables. By randomly assigning participants to different treatment groups or conditions, researchers can ensure that any differences in outcomes are due to the intervention being studied rather than pre-existing differences between the groups. Randomization can be applied at various stages of the research process:
- Random sampling: Selecting participants from the population of interest randomly, giving each individual an equal chance of being included in the study.
- Random assignment: Allocating participants to different treatment groups or conditions randomly, ensuring that any differences between the groups are due to chance rather than systematic factors.
- Random order of measurements: Conducting measurements or tests in a randomized order to minimize the impact of factors such as fatigue or learning effects.
Masking
Masking, also known as blinding, is a technique to reduce systematic errors arising from observer or participant bias. By keeping the participants, researchers, or both unaware of the treatment assignments or hypotheses being tested, masking helps to minimize the influence of expectations or preconceptions on the study results. There are several types of masking:
- Single-blind: The participants are unaware of the treatment they are receiving, but the researchers are aware.
- Double-blind: Neither the participants nor the researchers directly involved in the study know the treatment assignments.
- Triple-blind: The participants, researchers, and data analysts are all unaware of the treatment assignments until the end of the study.